Irrational exuberance has to come to an end eventually. Nothing better can explain it than Bitcoin.
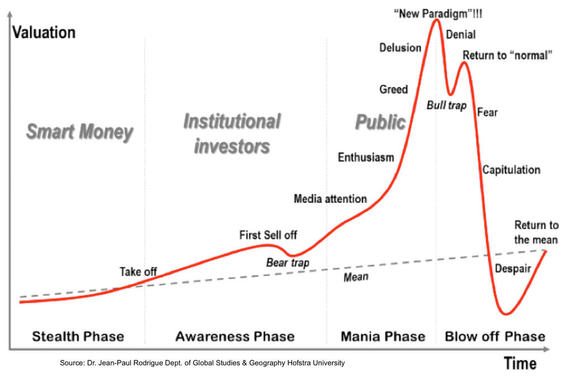
Similarity between Bitcoin and Bubble Chart
Looks like the bubble has finally burst and it has deflated a lot of investors across the globe. Despite warnings and triggers, People invested in the Crypto-Currency.
Those with major chunk would already have sold and booked profits, leaving retail/small investors on tenterhooks.
Just like Silver, Tulip and Shanghai Markets i.e typical examples of a bubble, Bitcoin too seems to have joined the club.
Bitcoin Bubble Chart
Image Source – MarketWatch
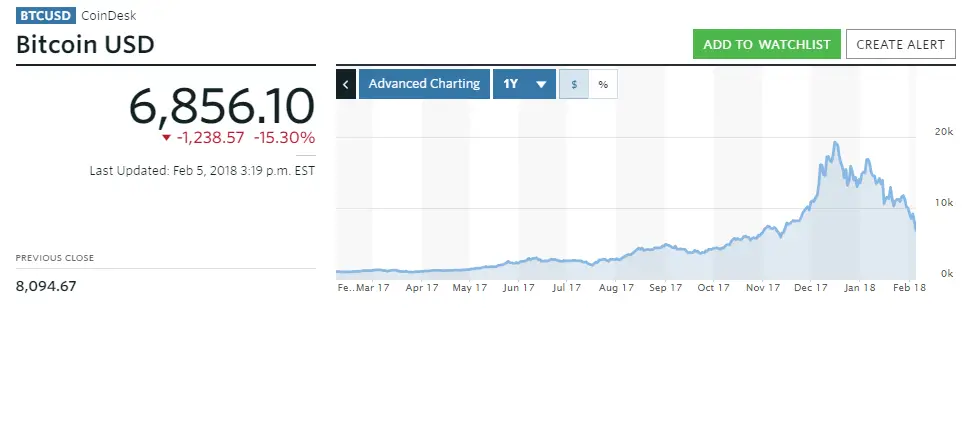
The price of one bitcoin (BTC) reached an all-time high of $19,783.06 on 17th Dec 2017 before retracing all the way to $6850 on 5th Feb 2018
It has since eroded over 65% of market value from the highs it made and in the process, has entrapped many investors who are possibly waiting for the next move. Either, they have to book losses or wait indefinitely to recover the cost.
As we write, 1 bitcoin is valued at $6856.10. It would be interesting to see where it goes from here.
“Risk comes from not knowing what you’re doing.” – Warren Buffet